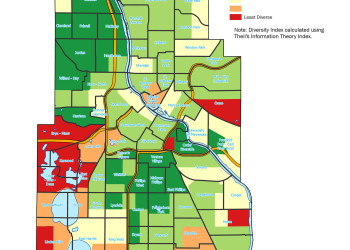
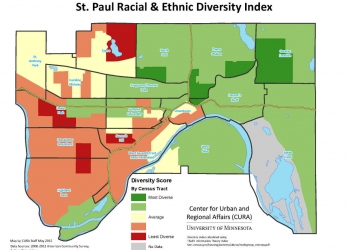
CURA’s Community GIS team created this map of Census 2020 return rates in Minneapolis and is updating it regularly through the 2020 collection period. Here is a St. Paul Census 2020 return rate map.
Click on an area to see the percentage of households who have responded to the census so far. Each area is a census tract. Click on the right arrow at top of the pop-up window to see how the current return rate compares to the final return rate in that area in 2010.
Darker tan colors represent lower response rates, while darker blue represent a higher response rate. A legend is available by clicking on the shapes icon in the upper right of the window.
Updated April 16, 2020 with the St. Paul Map.
Jeff Matson
Jeff Matson is director of the Community Geographic Information Systems (CGIS) program at CURA and is an adjunct faculty member in the Department of Geography.
Jeff is a graduate of the Masters in Geographic Information Science program at the University of Minnesota, where his research focused on environmental justice and public participation GIS.
Related program