Introduction and Charge
Property tax forfeiture is a core problem in many urban areas around the U.S. Property tax forfeiture is defined as the process whereby a property is forfeited to a government entity, typically a county government, due to the nonpayment of property taxes for a specified period of time. If it is pervasive enough, property tax forfeiture can result in decreased tax revenue for local governments and blight for neighborhoods with concentrations of tax forfeited properties. At the same time, tax forfeited properties can present an opportunity to county governments to improve neighborhoods by strategically using tax forfeited properties to increase the supply of affordable housing, introduce more green space or promote some other goal.
Every year properties are forfeited to Hennepin County because of nonpayment of property taxes. These properties differ in size and location within the county, and the number of forfeited properties varies by year. For example, in recent years Hennepin County typically had around 200-300 property tax forfeitures. In other contexts, the scale of property tax forfeiture is considerably larger. For example, Cleveland, Ohio routinely has more than 4,000 tax forfeitures in a year. In some cases, forfeited properties are only land, while in other cases forfeited properties include land and a structure. Common to all tax forfeited properties is the task for Hennepin County officials to choose from a range of options when determining how to dispose[1] of the properties.
In some cases, the future use of a tax forfeited property may be clear. For example, if a tax forfeited property is located in wetlands and is submerged by water for much of the year, then any use beyond green space may be infeasible if not legally impossible. However, it is also possible that a tax forfeited property is located where there is a lack of green space and limited affordable housing. In this scenario, whether the property should be used to create green space or host a subsidized housing unit may be unclear and contested.
The goal of this report is to gain a better understanding of how different strategies of disposing of Tax Forfeited Land (TFL) support, or could potentially support, three key county policy objectives:
- Promoting climate change mitigation and adaptation for Hennepin County;
- Increasing the amount of affordable housing for Hennepin County residents; and
- Reducing racial and economic disparities between Hennepin County residents.
Control of how tax forfeited properties will be used, or at least working with other governmental or nonprofit entities to coordinate control of how tax forfeited properties will be used, offers Hennepin County one path toward supporting the policy objectives listed above. On the other hand, selling tax forfeited properties to private entities may allow the county to promote these policy objectives directly depending upon the intended use by the new private owner or indirectly by increasing the amount of tax revenue collected by the county. In the latter case, more tax revenue due to bringing a tax forfeited parcel back onto the tax roll could indirectly support the policy objectives.
Generally speaking, Hennepin County disposes of TFL properties in one of the following ways:
- Sale to a government entity (e.g., HRA, a municipality, etc.)
- Sale to a private buyer via public auction
- Sale to an adjacent owner via auction
- Sale to a private buyer via an over-the-counter transaction
- Sale of a property via a traditional real estate process
Factors that county officials might consider when choosing from these disposition strategies include, but are not limited to, the level of required investment to make existing properties inhabitable, the degree to which the property is located in an ecologically sensitive area, the level of need for subsidized housing in the location where the property is located, existing municipal priorities as articulated in a comprehensive plan, and input from neighborhood residents and other stakeholder groups. Whether a tax forfeited property will remain in public ownership or sold to a private interest is determined in a classification process defined by state statute.
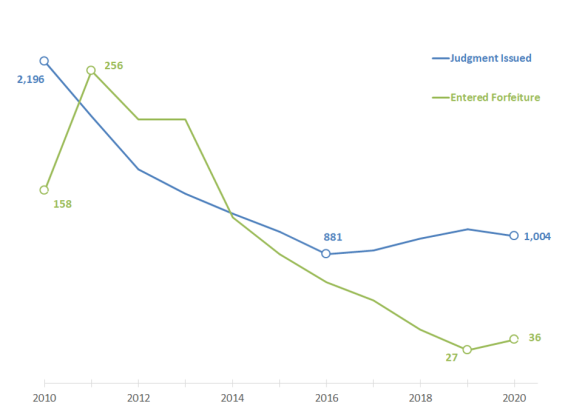
In this report we present trend data and a spatial analysis of historic and contemporary tax delinquent and tax forfeited properties in Hennepin County. Our results indicate that over time property tax judgments have declined, falling from about 2,200 at the end of 2010 to about half of that amount at the end of 2020, while property tax forfeitures have also declined over the same period, falling from 720 to 210.[2] From a spatial perspective, property tax delinquencies and forfeitures that occurred in Hennepin County between 2010 and 2020 were most frequently located in the City of Minneapolis, with particular concentrations in the Northwestern and central areas of the city. Smaller concentrations of delinquencies and forfeitures were located in the Northern and Western suburbs of Minneapolis.
Of particular note is the relationship between patterns of property tax forfeitures and neighborhood characteristics in Hennepin County that are related to stated county policy objectives. Property tax forfeitures tend to be concentrated in areas with substantial proportions of racial minority residents, high rates of poverty, rapidly increasing property values, and neighborhoods that are vulnerable to high temperatures during extreme heat events. The most recent tax forfeited properties follow a similar pattern, suggesting that Hennepin County may be able to address different goals by choosing between competing disposition strategies and, ultimately, how tax forfeited properties are used in the future. It is worth noting that properties ultimately forfeited to Hennepin County in recent years are relatively few in number in comparison to historical trends of numbers of tax forfeited properties. Overall, this is good news for the county and its residents, but it also means that strategic disposition strategies for forfeited properties may have only a limited effect on promoting other county goals.
The remainder of this report is organized into four sections:
- The first section describes the scales and spatial patterns of tax delinquent and tax forfeited properties in Hennepin County between 2010 and 2020, including a comparison of the distribution of tax forfeited properties and key neighborhood characteristics.
- The second section includes a discussion of different factors that may help guide the classification process used by the county to determine the disposition of tax forfeited properties. This section also introduces an interactive web tool that will help county staff and stakeholders in the Tax-forfeited Land section identify desirable uses for tax-forfeited properties given existing county goals and tradeoffs between competing potential uses.
- The third section compares short-term outcomes associated with tax-forfeited properties sold at auction compared to tax-forfeited properties sold via real estate listings. Auction sales have been a favored disposition strategy historically, while selling tax-forfeited properties through real estate listings is a strategy adopted by Hennepin County in recent years.
- The fourth section serves as a conclusion for the report and suggests policies and processes that the Tax-forfeited Land section may consider implementing.
Part 1: Historical Analysis
In recent years, the number of tax delinquent and tax forfeited properties in Hennepin County has decreased substantially. As Chart 1 illustrates, there were nearly 2,200 tax delinquent properties in judgment in Hennepin County at the end of 2010. This number fell each of the next six years before leveling off. Since 2017 the number of delinquent properties in judgment has fluctuated between approximately 900 and 1,100. Properties entering tax forfeiture increased from about 160 in 2010 to nearly 260 in 2011. Since 2011 the number of properties entering tax forfeiture in Hennepin County has steadily decreased, until only 36 properties entered tax forfeiture in 2020.
Chart 1: Number of tax delinquent and tax forfeited properties in Hennepin County, 2010-202
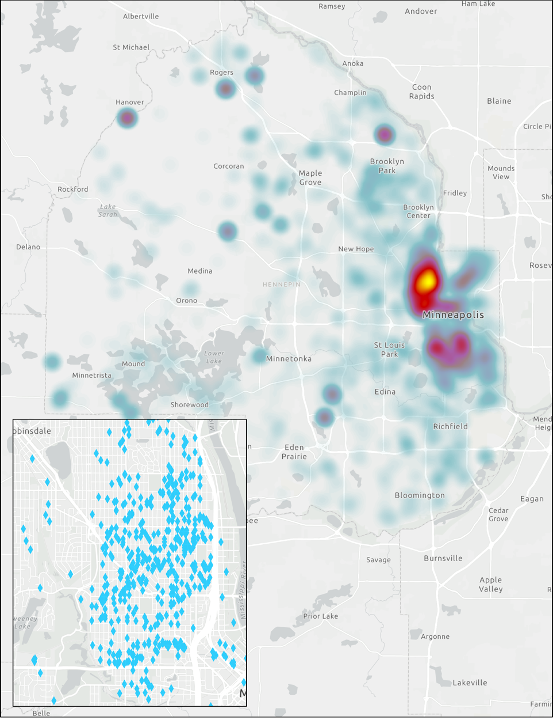
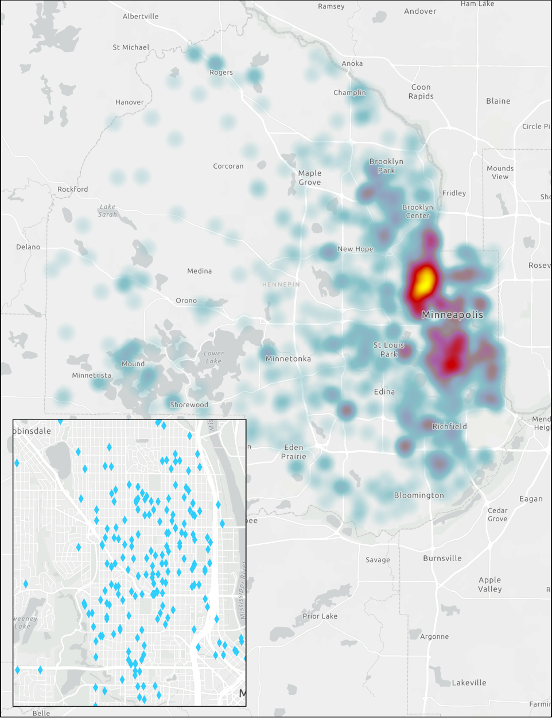
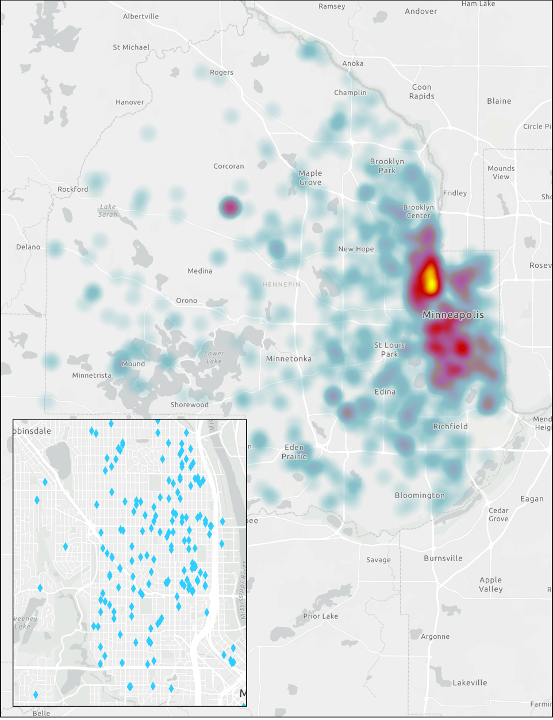
As the maps in Figure 1 indicate, while the scale of the number of properties entering tax delinquency judgments may fluctuate over time, the general spatial patterns remain relatively unchanged. Each map illustrates a “heat map” of tax delinquent properties entering into judgment in Hennepin County for the years 2010, 2015 and 2020. As indicated in Chart 1, the number of tax delinquent properties in judgment decreased substantially between 2010 and 2020.[3]Property tax delinquencies in each year were most prominent in North Minneapolis and central Minneapolis, with pockets of tax delinquent properties in Northern and Western suburbs. Just over 51 percent of delinquencies occurred in Minneapolis in 2010, a proportion that ticked up to 54 percent a decade later. The maps show evidence of property tax delinquencies thinly spread across suburban and exurban portions of Hennepin County. For the most part, “hot” spots of tax delinquency outside of Minneapolis were typically multifamily properties in tax delinquency.
Figure 1: Heat map of tax delinquencies in Hennepin County (2010, 2015 & 2020)
Note: Tax delinquent properties are properties in delinquency that proceeded to have a judgment entered in April of the delinquent year (Tax-forfeited Land Section).
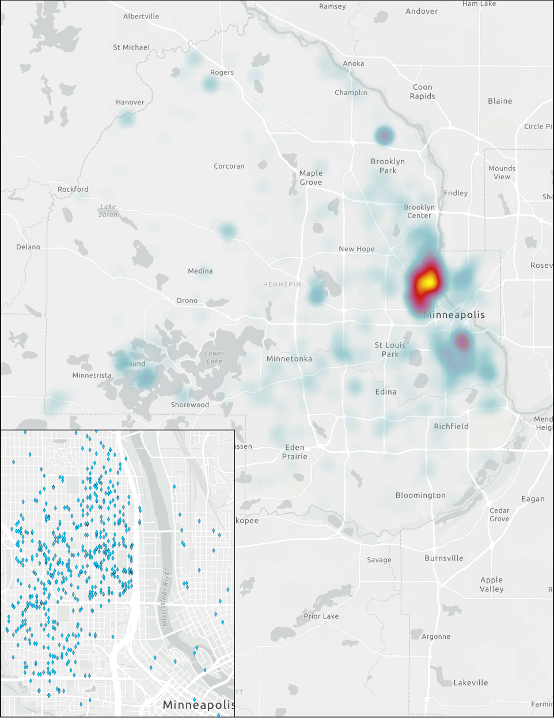
The spatial pattern of properties entering tax forfeiture generally corresponds to the pattern of tax delinquencies noted in Figure 1. Figure 2 depicts the spatial concentration of all properties entering tax forfeiture between 2010 and 2020. This map shows the unmistakable concentration of properties entering tax forfeiture in North Minneapolis during this time period, with a less prominent concentration of properties entering tax forfeiture in central Minneapolis. Again, following the pattern of tax delinquencies depicted in Figure 1, small pockets of property tax forfeitures occurred in Northern and Western suburbs, but tax forfeitures were scarce or non-existent in most other parts of Hennepin County. Nearly 75 percent of all forfeitures during this period occurred in Minneapolis.
Figure 2: Properties entering tax forfeiture, 2010-2020
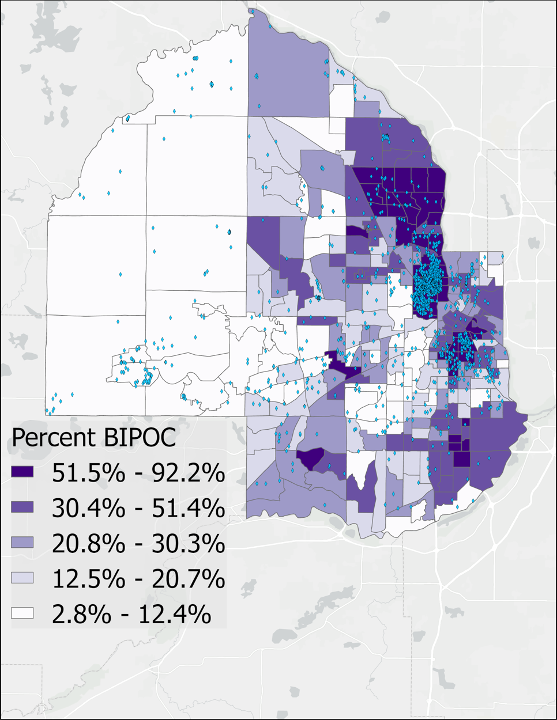
Additional figures included below show clear relationships between the density of tax forfeited properties and neighborhood demographic, economic and environmental characteristics. For example, Figure 3 shows the spatial distribution of all tax forfeited properties between 2010 and 2020 and the distribution of Black, Indigenous and People of Color (BIPOC) residents in Hennepin County. This map demonstrates a positive relationship between the proportion of BIPOC residents and the presence of tax forfeited properties in neighborhoods in Hennepin County. The disproportionate concentration of tax forfeited properties in neighborhoods with majority BIPOC residents is highlighted by comparing the proportion of forfeited parcels located in majority BIPOC neighborhoods with the proportion of the total number of parcels and households in Hennepin County located in these same neighborhoods.[4]In fact, 55 percent of forfeited properties between 2010 and 2020 were located in neighborhoods where more than half of the residents were BIPOC. In comparison, only 12 percent of the total parcels and 15 percent of the total households in Hennepin County were located in majority BIPOC neighborhoods. A much smaller proportion of forfeited properties were located in neighborhoods with small BIPOC resident populations. Specifically, only 15 percent of forfeited properties between 2010 and 2020 were located in neighborhoods where the percentage of BIPOC residents was less than about 12 percent. In comparison, these neighborhoods contained 24 percent of the total parcels and 19 percent of the total households in Hennepin County.
Figure 3: The distribution of tax forfeited properties between 2010 and 2020 and Black, Indigenous and People of Color (BIPOC) residents in Hennepin County
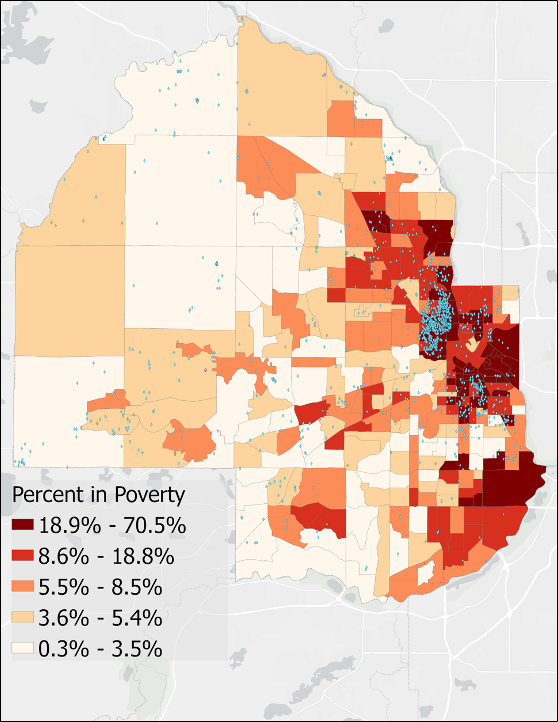
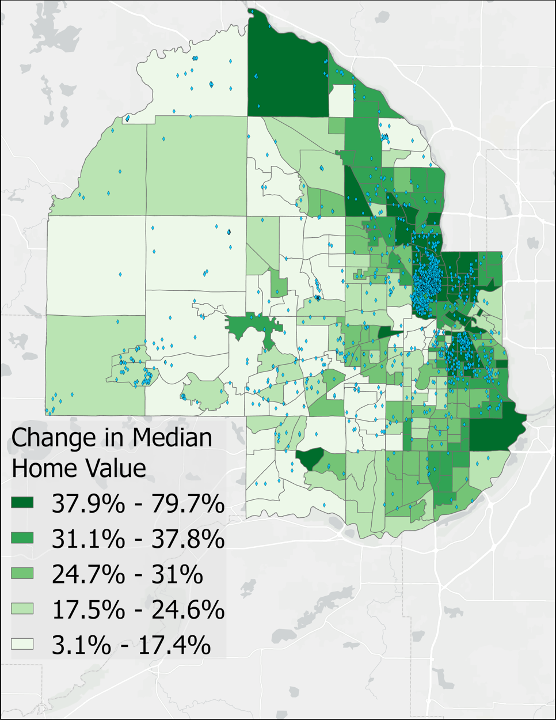
Figures 4 and 5 indicate a similar pattern between the distribution of all tax forfeited properties between 2010 and 2020 and the percent of residents living in poverty and the increase in property values, respectively. High poverty neighborhoods may be a proxy measure for economic distress that makes tax forfeiture more likely, while high levels of appreciation in property values may indicate neighborhoods marked by rapid increases in property tax bills that residents have difficulty paying. As shown in Figure 4, poverty and tax forfeiture has a positive relationship, with nearly 50 percent of tax forfeited properties between 2010 and 2020 located in neighborhoods where the poverty rate was about 19 percent or higher. In comparison, these neighborhoods contained only 10 percent of the total parcels and 16 percent of the total households in Hennepin County. Figure 5 indicates a positive relationship between the percentage change in median home values between 2014 and 2019 and tax forfeited properties between 2010 and 2020. In this case, 54 percent of tax forfeited properties were located in neighborhoods where the change in median home values was at least 38 percent. In comparison, 13 percent of the total parcels and 15 percent of the total households in Hennepin County were located in these neighborhoods. Together, Figures 3, 4 and 5 suggest that in the past decade tax forfeited properties were most prevalent in neighborhoods characterized by majority BIPOC residential populations, high rates of poverty and property values that have experienced rapid appreciation in recent years.
Figure 4: The distribution of tax forfeited properties between 2010 and 2020 and the percent of households living under the poverty line in Hennepin County
Figure 5: The distribution of tax forfeited properties between 2010 and 2020 and the percentage change in median home values in Hennepin County between 2014 and 2019
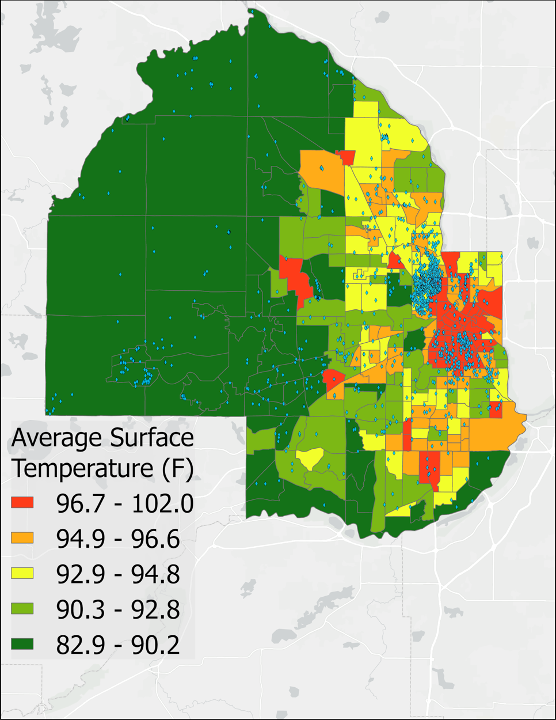
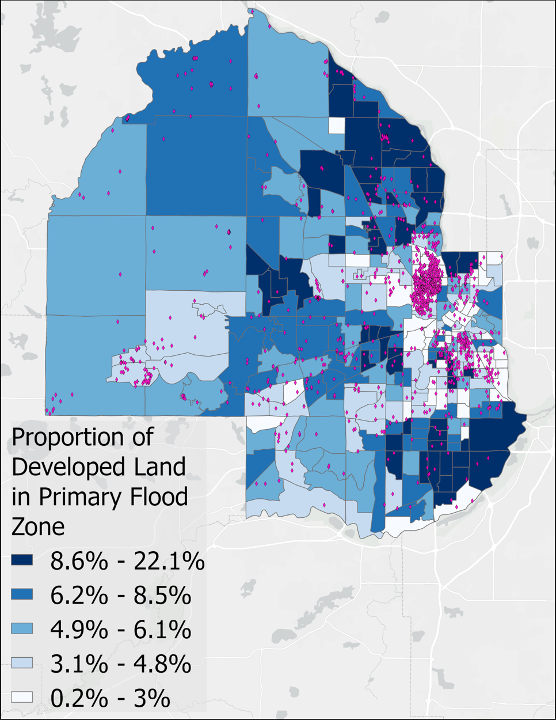
In contrast to the disproportionate presence of tax forfeited properties in neighborhoods characterized by majority BIPOC residential populations, high poverty rates, and properties that recently rapidly appreciated in value, tax forfeited properties and two measures of environmental vulnerabilities in Hennepin County do not have a strong correlation. For example, Figure 6 shows that tax forfeited properties were not necessarily clustered in neighborhoods with the highest average surface temperatures during a recent extreme heat event in Hennepin County. In this case, about one in five tax forfeited properties were located in neighborhoods with the highest average surface temperature readings. These neighborhoods contained 14 percent of the total parcels and 21 percent of the total households in Hennepin County. Figure 7 indicates that tax forfeited properties had a negative relationship with locations at high risk of floods. In fact, nearly 40 percent of tax forfeited properties were located in neighborhoods with the lowest proportions of developed land in primary flood zones in Hennepin County. These neighborhoods contained 17 percent of total parcels and 18 percent of the total households in Hennepin County. In general, portions of Hennepin County with developed land most at risk of flooding are in the Northeastern and Southeastern corners of the county where relatively few tax forfeited properties were located. It is important to note that high surface temperatures and flood risk are only two indicators of environmental vulnerability, which is an exceptionally complicated and multifaceted phenomenon. A more thorough analysis of this topic might show different relationships between the location of tax forfeited properties and other measures of environmental vulnerability, such as air quality.
Figure 6: The distribution of tax forfeited properties between 2010 and 2020 and the average tract-level land surface temperature during an extreme heat event (2016) in the Twin Cities metropolitan area.
Figure 7: The distribution of tax forfeited properties between 2010 and 2020 and the proportion of developed land in the primary flood zone.
Part 2: Outcomes for forfeited properties sold at auction versus sold through real estate listings
Historically, Hennepin County has disposed of many of its tax forfeited properties through public auctions. Although the county occasionally listed properties for sale through real estate brokers, in 2018 Hennepin County pivoted from the traditional auction process toward exclusively working with real estate brokers to list tax forfeited properties for sale in real estate listings. In Table 1 we provide a comparison of characteristics of properties sold in the final year of auctions, 2017, with all broker sales that occurred in 2019. Comparing auction and broker sales properties and outcomes associated with each sales strategy two years after the sales sheds some light on how the change in sales strategy affected outcomes like property values and new episodes of tax delinquency. When considering these comparisons it is important to note that we hold constant the length of time of the period after each type of sales (two years), but that different economic or real estate conditions in the two periods (2018-2019 and 2020-2021) and differences between each group of properties could influence the outcomes we observe.
In 2017 Hennepin County sold 37 tax forfeited properties through public auction. Two years later, three of those properties, or around eight percent, were entered into judgment. In comparison, three of the 17 tax forfeited properties sold through broker sales in 2019 were entered into judgment (about 18 percent) two years after the sales. This comparison may suggest that tax forfeited properties sold through broker sales are more likely to fall into tax delinquency compared to tax forfeited properties sold at auction.
However, two factors make drawing apples-to-apples comparisons between these groups of properties difficult and suggest that this conclusion may be unfounded. First, the small number of properties in each group means that the observed differences could be due to chance rather than a real difference. Second, the tax forfeited properties sold via auction and brokers differed in a variety of ways. Perhaps most importantly, a larger proportion of auction sales properties were vacant parcels compared to auction sales properties. Nearly 80 percent of the auctioned properties were vacant lots compared to about 60 percent of the brokered properties.
The different proportion of vacant properties in each group likely influenced the large difference in the assessed market values of the two groups of properties. Two years after the sales, the median assessed market value of auction properties was $8,600, unchanged from the median assessed market value at the time of the sale. In comparison, two years after the sales the median assessed market value of broker sales properties was $98,000, a dramatic increase from the median assessed market value at the time of the sales ($22,300). The large disparity in assessed property values between the auction and broker sales properties means that median taxes owed also differed significantly, and the larger tax bill for broker sales properties may have increased the likelihood that some of these properties became delinquent in taxes.
Although a greater proportion of the broker-sale properties entered into judgment after two years, other metrics suggest that those properties fared better than properties sold at auction. The number of vacant lots among broker sold properties declined by half, from 10 to five, while there was no change in vacancy rates among the auction sold properties. As indicated above, this extra development corresponded to an increase in the median market value of broker sold properties of $75,700, or 339 percent, in only two years, compared to no change among the auction sold properties.
It is important to be cautious in drawing any firm conclusions about differences in outcomes for tax forfeited properties sold at auction versus broker sales given the small number of properties we are able to include in our comparison, the relatively short time period we used to assess outcomes of interest and important differences between the groups of properties that may have influenced the outcomes we observed.
Table 1: Characteristics of tax-forfeited properties sold in the final year of auctions (2017) and all broker sales that occurred in 2019
Part 3: Relationship between TFL disposition strategies and goals with contemporary forfeited properties
As the figures above demonstrate, the spatial distribution of tax forfeited properties has an important set of relationships with different neighborhood characteristics that relate to Hennepin County goals. To the extent that these characteristics are linked to the county goals listed above, decisions the county makes on disposing of tax forfeited properties could have an effect on the county’s progress in working toward their goals. For example, converting forfeited parcels to green spaces that increase the tree canopy could help reduce the heat island effect that Figure 6 indicates is historically a prevalent issue in central Minneapolis, which hosts a substantial number of tax forfeited properties. At the same time, many of the neighborhoods that suffer from a heat island effect are also characterized by high rates of housing cost burden, signaling a shortage of affordable housing for residents. If Hennepin County chooses to support the construction of a subsidized housing unit on a forfeited property located in such a neighborhood, they may help reduce disparities in housing but not increase green space that can mitigate the heat island effect. With these examples in mind, which disposition strategy Hennepin County ought to pursue for a forfeited property is not always clear.
Given the ambiguity in the “correct” policy choice that we note above, we believe that an engagement strategy that complements expertise of TFL staff members with input from community-level stakeholders when making these decisions is in order. The vehicle for such an engagement process currently exists in the form of the statutorily defined “classification process.” This process seeks public comment on whether tax forfeited properties should be classified or reclassified as conservation or non-conservation and includes the current or potential use of the land. Participants in this process have the ability to make comments or suggestions about the classification or reclassification of a tax forfeited property, including plans, ideas or projects that might include acquisition of the property in question. Participants may also provide information from comprehensive land use plans that is relevant for the property.
To help facilitate the classification process for tax forfeited properties in Hennepin County we have developed an interactive web application designed to provide critical information that can help inform the decision makers and interested stakeholders about disposition options for tax forfeited properties. There are several advantages to this approach including a publicly accessible visual representation of TFL properties with the surrounding context, consolidation of the data necessary to make decisions regarding these properties into a single location, and a mechanism for better understanding the trade-offs and oftentimes competing goals the county has prioritized in this process.
Both its interactive nature and accessibility from any computer or smart device strengthens the public benefit and understanding of TFL disposition. Stakeholders, including but not limited to TFL staff, elected officials, nonprofit organizations, real estate developers, and community residents, can click on individual properties of interest for timely information from the county parcel database as well as any number of overlay layers displaying demographic, socioeconomic, or environmental characteristics, which may aid in decision making. The web application provides transparency into information about tax forfeited properties and the context in which these properties are located. Users would be able to see who owns an adjacent property, land use and zoning information, taxable value, proximity to other assets and amenities, and any number of other variables added to the system.
The county maintains hundreds of datasets across a number of departments, just some of which are necessary for decisions around TFL disposition. This application brings together those data that are most relevant to the TFL disposition process without requiring users to search across multiple departments or data sources, download and combine data on their own, or take up valuable staff resources when researching a particular property. The data is in one place and the application is easy to use. Given the three policy objectives stated at the outset of this report, a mapping application will also provide a clearer look at how these factors interact and overlap. Highlighting the competing interests and any trade-offs the county must face when disposing of TFL properties will be a key strength of the application.
The web mapping application produced alongside this report should be considered a prototype of sorts that might incorporate data layers provided by county departments. Perhaps there are additional data layers that TFL staff would deem necessary or perhaps some of the current layers in the prototype will be considered extraneous. The flexibility of a web application allows for easily updated dynamic data (i.e., automatically updated at regular intervals) and the incorporation of additional datasets with minimal effort.
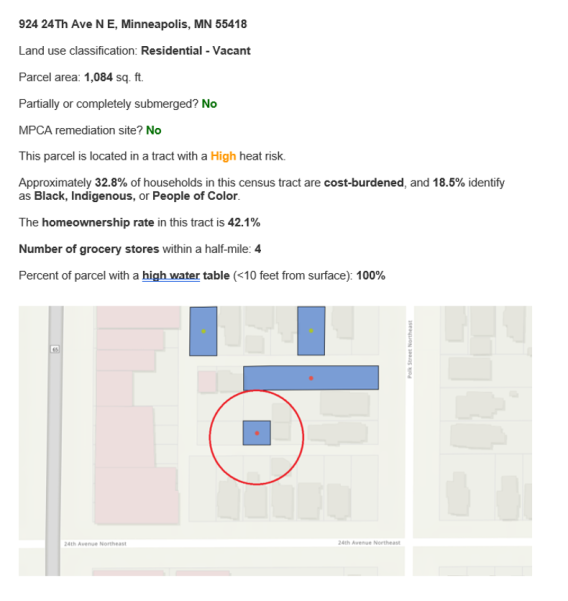
A set of examples illustrates how the website might be used by stakeholders to provide input into the classification process. The first example, illustrated in Figure 8, shows a relatively small (approximately 1,000 square feet), vacant tax forfeited property located on the Northside of Minneapolis. Though the parcel is located in a neighborhood with a relatively high level of housing cost burden (33 percent), the small size of the parcel likely makes it unsuitable for housing. On the other hand, the property is located in a neighborhood with a high heat risk and a high water table, so using the parcel to increase the amount of greenspace in the neighborhood might be an attractive disposition strategy.
Figure 8: Example 1 from the TFL interactive web application
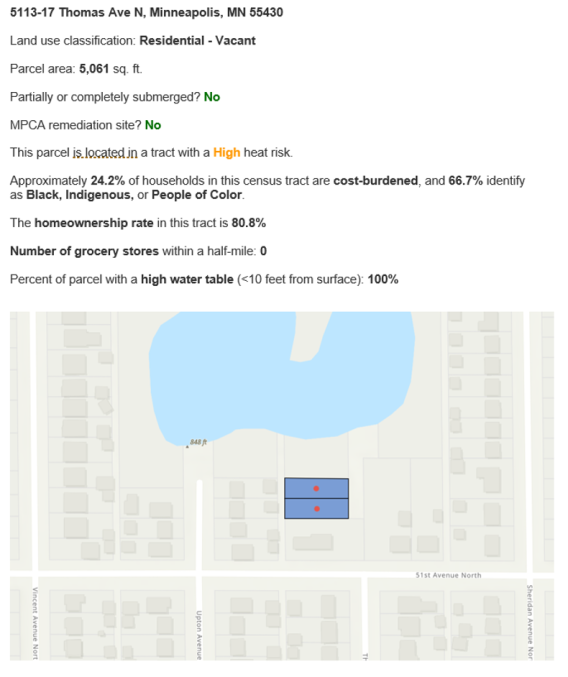
The second example, shown in Figure 9, involves two nearly identical vacant forfeited properties, again on the Northside of Minneapolis, that are each substantially larger than the property in Figure 8 (each approximately 5,000 square feet). In this case, access to the affordable housing in the neighborhood is relatively less constrained, but the neighborhood has a high heat risk and both parcels are located on high water tables. Whether the tax forfeited properties are used for additional green space or housing is debatable and deserves careful consideration after seeking public input.
Figure 9: Example 2 from the TFL interactive web application
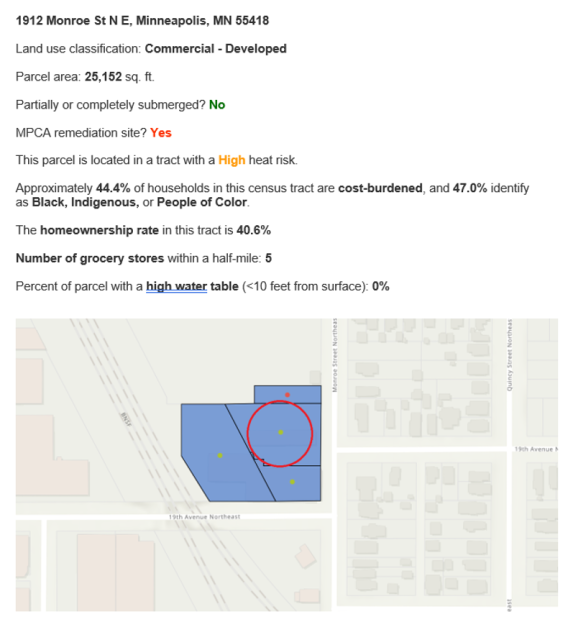
The third, and final, example, shown in Figure 10, involves a large, vacant tax forfeited property that is adjacent to three other tax forfeited properties in Northeast Minneapolis. At over 25,000 square feet, this parcel could likely support a multi-unit property and is located in a neighborhood where housing cost burden affects nearly half of the households. This suggests that the parcel may be a good candidate for housing. On the other hand, the parcel is listed as a remediation site by the Minnesota Pollution Control Agency (MPCA), which indicates that cleaning the site sufficiently to allow the construction of housing may add considerable cost to the parcel’s development. As a result, using the parcel for green space, given the high heat risk of the neighborhood, might be a more viable option.
Figure 10: Example 3 from the TFL interactive web application
Part 4: Conclusion
In the past ten years, Hennepin County has experienced a substantial decrease in the number of properties entering into tax delinquency and forfeiture. There is no guarantee that the relatively small number of tax forfeited properties in Hennepin County in recent years is a trend that will continue. While there is still a lull in tax forfeitures, the county has the opportunity to reflect on the choices it makes when disposing of tax forfeited properties and how disposition choices could support other county goals related to mitigating risks associated with climate change, increasing the supply of affordable housing and reducing racial disparities among Hennepin County residents.
The results of our analysis of tax delinquent and forfeited properties highlighted in this report indicate that the recent spatial patterns of tax delinquency and forfeiture remain stubbornly concentrated in North and central Minneapolis and appear to have a positive association with the percent of BIPOC residents in a neighborhood, poverty, and rising home values. Concentrations of tax forfeitures have a more ambiguous relationship with the limited number of measures of environmental vulnerability considered in this report. Still, it is clear that disposition choices of some tax forfeited properties could influence the ability of some neighborhoods to mitigate environmental vulnerabilities.
We believe that the interactive web application we developed that incorporates parcel level data on tax forfeited properties and socioeconomic and environmental characteristics of neighborhoods can help the TFL program produce well-informed decisions about the disposition of tax forfeited properties. The interactive web application provides quick and relevant data about tax forfeited properties and characteristics of the neighborhoods where tax forfeited properties are located. Equally important, it can provide the same information to the wider public and particularly stakeholders who may wish to participate in the classification process. Well-informed participation in the classification process will provide TFL staff with useful guidance on community interests in tax forfeited properties. The interactive web application may also allow TFL staff to explain the rationale for choosing one disposition strategy over another to stakeholders in the TFL program. This last point may be especially important when different disposition strategies align with different county goals and it is not possible to promote multiple county goals simultaneously.
[1] We use the term “dispose” in its legal sense, meaning to transfer to the control of another.
[2] Tax delinquent properties are properties with outstanding property tax balances in January the year following when the taxes were due. However, in this report, when referring to delinquent properties we include only those delinquencies that proceeded to have a judgment entered in April of the delinquent year and failed to pay off all taxes in full by the end of the calendar year. Tax forfeited properties are those properties with unpaid taxes following the expiration of the allowable redemption period as determined by state statute.
[3] Heat maps illustrate the relative concentration of tax delinquent properties in a given year. When comparing heat maps across years, different patterns signal variation in relative concentrations of tax delinquent properties between the years rather than changes in the number of tax delinquent properties between years.
[4] For more detail on the distribution of forfeited properties, total parcels, and households across different neighborhood characteristics see Appendix 2.
Appendix 1: Data and Methods for Interactive Web Application
The interactive web application was created in partnership with the University of Minnesota’s Humphrey School of Public Affairs, the Center for Urban and Regional Affairs, and Hennepin County’s Office of Taxpayer Services. The purpose of this application is to provide greater transparency with regard to tax forfeited property in Hennepin County and to act as a stakeholder engagement tool accessible to the public for better decision making around the disposition of tax forfeited land (TFL). The interactive map that is the centerpiece of the application consists of publicly available information updated from government data sources both local and national. In addition to base layers related to tax forfeited properties and boundary files, there are three main categories of data layers that correspond to the following TFL program goals:
- Reducing racial and economic disparities
- Creating affordable housing
- Climate change mitigation and adaptation
The primary data sources are: Hennepin County and Hennepin County’s Resident and Real Estate Services, Property Tax Division, the U.S. Census Bureau (American Community Survey 2014 & 2019 5-year averages), and the Metropolitan Council, which derived flood data from FEMA flood maps. Socioeconomic and demographic data are provided at the Census Tract level, where other layers are represented as address points or the actual physical boundaries of each feature.
Hennepin County will manage and update the application, including updates to the data based on the frequency of updates to the various data layers.
Base Layers and Administrative Boundaries
Tax Forfeited Properties (TFL)
Description: current (2021) tax forfeited properties joined with county parcel data
Attributes: Land Use classification, area, park or wetland, MPCA remediation status
Data source: created by Center for Urban and Regional Affairs using data provided by Hennepin County, the Metropolitan Council and the Minnesota Pollution Control Agency
Cities and Townships
Description: boundaries for cities, townships, and unorganized territories within Hennepin County.
Data source: Hennepin County, MetroGIS, MN Geospatial Commons
Commissioner Districts
Description: Boundaries of Hennepin County Commissioner Districts
Data Source: Hennepin County
Census Tracts (2020 Census Population)
Description: Updated Census Tract boundaries
Source: U.S. Census Bureau
Historic Tax Forfeited Properties (2010-2020)
Description: Database of end-of-year tax forfeiture status (delinquent, judgment, purchase, auction, etc.)
Source: Hennepin County Resident and Real Estate Services, Property Tax Division
Data Addressing Disparities
Percentage of the Population Living in Low-Income Households
Description: People whose family income is less than 185% of the federal poverty threshold, as a proportion of all people for whom poverty status is determined.
Source: ACS 2019 5-year averages, from Met Council Equity Considerations dataset
Percentage of the Population that identifies as Black, Indigenous, or Persons of Color (BIPOC)
Description: Total population minus those identifying as White and non-Latinx
Source: ACS 2019 5-year averages, from Met Council Equity Considerations dataset
Percentage of Renter Occupied Households
Description: Renter households as a percentage of total occupied households
Source: ACS 2019 5-year averages, from Met Council Equity Considerations dataset
Data Addressing Housing Affordability
Percentage of Cost-burdened Households
Description: Households spending more than 30% of their income on rent or a mortgage and utilities
Source: ACS 2019 5-year averages, from Met Council Equity Considerations dataset
Increase in Home Value (2014-2019)
Description: Percent change in inflation-adjusted median estimated market value of owner-occupied housing between 2014 and 2019
Source: ACS 2019 5-year averages, from Met Council Equity Considerations dataset
Data Addressing Climate Change
Flood Risk
Description: Percent of developed land in the primary flood zone. Flood zones were identified as those vulnerable to flooding in an extreme rain event based on depressions in the State of Minnesota’s 3-meter digital elevation model. Primary flood zones have a depth of 0-2 feet and are the quickest to fill in an extreme rain event, so any assets or infrastructure in those areas are considered to be at greatest risk
Source: Met Council Flood Map Screening Tool/Met Council Equity Considerations dataset
Extreme Heat Risk
Description: Average tract-level land surface temperature on July 22, 2016 for the Twin Cities metropolitan area. The data come from Landsat 8 Thermal Infrared Sensor imagery taken during a July 2016 heat wave. Tracts are categorized according to the number of standard deviations from the mean average temperature
Source: Met Council Extreme Heat Map Tool/Met Council Equity Considerations dataset
