Authors: Ryan Allen, Susan Bergmann, Madeline Geitz and Stefan Hankerson
This report addresses affordable housing in rural areas in the United States and the upper Midwest, with a particular emphasis on conditions in Minnesota. Within this context, we provide descriptive information about the stock of multifamily housing that is part of the United States Department of Agriculture (USDA) Section 515 housing program and assess the scale and scope of ongoing concerns related to the future of this program. As properties in the Section 515 program mature out of the program in the next 10 to 30 years, Minnesota stands to lose a substantial proportion of rental housing currently used by low-income households in nonmetropolitan areas of the state.[1] With no clear contingency plan for maintaining affordability in these properties, many of the properties may exit the program as the terms of their affordability restrictions expire. This could mean the displacement of many tenants living in 515 properties that rely on the housing subsidies that accompany these units.
This report is divided into three sections. The first section provides background on affordable housing in rural America. The second section presents the historical context of government intervention in the rural housing market, which includes an overview of the USDA Section 515 program. The third section provides descriptive information about the properties and tenants in the 515 program in the Midwest, which includes Minnesota, Iowa and Wisconsin.
Background of Affordable Housing in Rural America
Like urban areas in the U.S., rural areas currently face a housing affordability crisis. National economic restructuring in rural areas has driven part of this crisis. Many residents of rural areas have struggled to keep up with an economy that has increasingly shifted from agricultural-based to specialized service and retail-oriented industries. This economic restructuring has been associated with higher rates of rural poverty, leading to intra rural migration in search of affordable housing.[2] This mobility often begets greater family instability and fragmented utilization of health and social services.[3]
Perhaps the foremost reason for rural America’s affordable housing crisis is the lack of an adequate housing stock. Housing adequacy is an issue that is distinct from housing affordability and availability. Issues of housing adequacy concern physical characteristics of the unit that do not meet the standards set by federal and state regulations. The US Department of Housing and Urban Development (HUD) defines housing adequacy “… based on the level of internal physical and health conditions, structural defects, and overcrowding. Housing may be considered moderately to severely substandard (inadequate) depending on the number of deficiencies identified.”[4] Rural areas are more likely to experience substandard housing due to an older housing stock, less compliance and enforcement of codes, a shortage of lending institutions, lower family incomes, and fewer housing options.[5] These factors put a strain on prices of the already limited housing stock, making it all the more difficult for those of all income levels to find adequate housing, but especially low-income renters.
Approximately 6.9 million (27 percent) of rural or small-town households are considered “cost-burdened” (paying more than 30 percent of their monthly income on housing costs).[6] Furthermore, most households that experience housing cost burden have low incomes, and are disproportionately renters. Of the cost-burdened households in rural areas, nearly 40 percent are renters, despite renters only comprising about 25 percent of all rural households.[7]While housing costs are lower in non-metropolitan areas, low-income households in rural areas still struggle to find affordable housing. This often leads to an increased frequency of moving for rural renters.
The affordable rental housing shortage in rural America affects different demographic groups in different ways. The population of rural renters has seen a growing proportion of young single-parent families and older single-headed households. The older population of rural renters (aged 65+) faces their own unique challenges. Approximately 9.5 million rural older adult households live below the federal poverty level, and 36 percent of rural older adults are housing cost burdened.[8] Poverty rates among older adults of marginalized groups are higher than average, with 26 percent of Black households, 23 percent of Native American households, and 17 percent of Hispanic households headed by older adults living in poverty.[9] Availability of housing for older adults in rural areas varies significantly by region and even from town to town. In 2006, no town of 500 or smaller had a nursing home, suggesting a lack of available infrastructure to support the aging population in nonmetropolitan areas of the U.S.[10] Overall, the older adult population is increasing in rural areas, placing a heightened responsibility on local and state governments to support this population.
Two other important groups in understanding the rural housing shortage and the rural economy are immigrant families and seasonal migrant workers. Immigrants are often attracted to rural areas because it is less expensive and still offers a high quality of life.[11] As a region’s economy expands, rural industries see a greater need for labor, which in turn increases the demand for housing. Migrant farmworkers and seasonal farmworkers often earn very low wages and have great difficulty finding adequate housing. According to findings by the Housing Assistance Council, 60 percent of farmworkers obtain housing in the private market.[12] In the past, migrant workers could often obtain housing through their labor agreement, as a third of all farmworkers lived in employer-owned housing in 1995. However, in 2011 only 13 percent of farmworkers lived in employer-owned housing, placing a greater burden on farmworkers and their families to find adequate and affordable housing.[13]
Despite the growing body of evidence that there is a need for additional affordable housing in rural areas, there are significant barriers that often prevent the development of affordable housing in these areas. The lack of affordable housing options in rural areas is related to federal budget cuts, inadequate financing for nonprofit development organizations, and competition with urban areas for scarce federal grants.[14] Because programs can have a variety of priorities and projects typically require many different sources of funding, the difficulty of obtaining public investment is a high barrier in meeting the housing needs of the rural rental market. Another inhibitor to the development of affordable housing in rural areas is a lack of interest from developers and builders, as developers may find metropolitan areas more profitable and therefore more desirable. Low rents in rural areas can make development in these areas an unattractive prospect for developers.[15] One of the most substantial barriers to adding affordable housing in rural areas is public opposition. Some rural communities wish to keep their sense of rural atmosphere, and tend to adopt a NIMBY mentality when faced with the potential development of affordable housing. This opposition can cause delays in development, force the tenant profile of developments to change, and halt development with demands that are difficult to satisfy.[16] Further barriers include increasing construction costs that price out younger families, and a high percentage of older adults living in rural communities that are content to age in place, causing a bottleneck effect in the housing market of rural areas.[17]
Government Attention to Rural Housing
Several federal programs offer relief to rural renters. The USDA Section 521 rental assistance program provides assistance for nearly 273,000 low-income tenants in Section 515 properties.[18] The Department of the Treasury administers the Low-Income Housing Tax Credit (LIHTC) program through state housing finance agencies to encourage private investment and development of affordable housing for low-income households. Of the 2.4 million units that are subsidized by the LIHTC program, 270,000 are located in rural areas.[19] HUD administers the most programs targeted toward low-income households. The Section 202 Multifamily Housing for the Elderly program provides construction, rehabilitation, and operation of residential projects and facilities for the elderly.[20] Public Housing Authorities had 232,800 units of public housing located in rural areas in 2009.[21] In 2013, there were close to 28,000 low-income rural tenants living in USDA financed rural rental housing that received Section 8 rental assistance.[22] In the same year, just over 20,000 rural households received HUD Housing Choice Vouchers to live in privately owned properties.[23] Lastly, the Rural Housing Stability Assistance Program is designed to provide stable housing for individuals experiencing homelessness and those in the worst housing situations.[24]
USDA Section 515 Program Overview
Section 515 was amended to the Housing Act of 1949 through the Senior Citizen Housing Act of 1962, initially authorizing USDA to make loans in order to provide rental housing for low-income and moderate-income elderly families in rural areas.[25] Amendments in 1966 widened the program’s scope to provide loans for rental housing that targeted low and moderate-income families generally. Additional changes in 1977 opened the program up to congregate housing for the elderly and handicapped.[26]
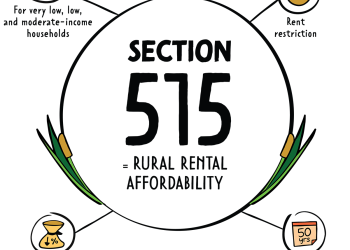
The Rural Development (RD) division of the USDA oversees the administration of the Section 515 program. The Section 515 program offers competitive loans encouraging developers to build multifamily rental housing for very low (50 percent AMI), low (80 percent AMI), and moderate-income ($5,500 more than 80 percent AMI) households. These loans are 30 years, amortized over 50 years, and essentially have an interest rate of 1 percentdue to the Interest Credit Subsidy.[27] Borrowers of Section 515 loans are restricted in the amount of rent they may charge tenants, making the program important for rural rental affordability.[28]
Section 515 properties are classified with one of five designations: family, elderly, mixed, congregate, or group housing. All tenants must meet the income eligibility of very low, low, or moderate-income. Each project type serves a different population.
- Family properties: income eligible households
- Elderly properties: income eligible tenants must have a disability or be 62 years or older
- Mixed properties: family and elderly units in the same property
- Congregate properties: income eligible tenants who are elderly and require meals or other services be provided; this designation is not intended to operate like a nursing home, although there are similarities, so costs of health services are not covered through this program
- Group housing: income eligible tenants who are elderly or have a disability; different from other elderly designations, units have shared living space and a tenant may require a resident assistant[29]
Since the inception of the Section 515 program, over 550,000 rural rental units have been developed nationally. Mortgage prepayments, mortgage maturity, and foreclosures have reduced this number to 410,000 units as of 2016.[30]Section 515 properties can be found in 87 percent of all U.S. counties and, in many cases, offer the only source of subsidized housing to that community.[31] Households living in these properties have an average income of $12,588, and nearly 63 percent are headed by either an elderly person or an individual with a disability.[32]
The Section 515 Program Evolves
In 1974, Section 521, or the Rural Rental Assistance Program, was approved by Congress. Tenants in Section 515 developments classified as very low-income or low-income are eligible for this rental assistance subsidy. This subsidy is a “pass through” benefit akin to a housing voucher program: tenants must pay 30 percent of their income and RD pays the remaining rent amount directly to the owner. Section 521 is seen as an incentive to keep owners in the Section 515 program. However, allocations to this rental assistance are subject to Congressional approval, appropriations vary annually, and the program has never been fully funded to cover all who are eligible, thus creating a tenuous situation for tenants who receive this rental assistance.[33]
The RD Voucher Program was approved in 1992, but did not receive funding until 2006. Tenants are eligible for this RD Voucher Program after the owner prepays the loan or the property is foreclosed. The RD voucher amount is determined at the time of prepayment or foreclosure when market rates are set for the units. The voucher amount never changes, meaning tenants must pay any differences due to rent increases, regardless of income changes. Tenants living in Section 515 properties in which the mortgages are still maturing are not eligible for these vouchers.[34]
The provision in the Section 515 Program allowing prepayment of the mortgage allows owners of properties in the 515 program to exit the program early, potentially resulting in increased rents for tenants and threatening tenants’ housing stability.[35] Congress passed various legislation from 1979 to 1992 to stave off these damaging effects:
- 1979: All developments financed after December 21, 1979 had a 20-year use restriction (15-year use restriction if Rental Assistance was not used to subsidize rents.)
- 1988: The Emergency Low Income Housing Preservation Act of 1987 (ELIHPA) was intended to stop the displacement of tenants resulting from the prepayment outcomes. Prepayment restrictions were placed on all developments financed before December 21, 1979. Note that the prepayment restrictions do not prevent the prepayment of the loan, but instead require incentives be offered by RD to the owner. The incentives should encourage the owners to remain in the program for another 20 years. If the owner declines the offer, the prepayment process enters a series of steps to ensure the tenants are protected. For example, part of this process includes determining if there will be a negative impact on minority housing opportunities.
- 1989: Use and prepayment restrictions were enacted for the full term of the loan for all developments financed after December 14, 1989. This, in essence, prevented the prepayment of the mortgage loan. Because loans within the Section 515 program were 40 or 50 year terms, the length of the loan was reduced to 30 years, and allowed an additional 20 year renewal.
- 1992: The prepayment restrictions under ELIHPA was expanded to cover all loans financed within 1987 and 1989, a term not previously covered.
The Section 515 Program in the Midwest
As of 2020, the Midwest, defined in this report as Minnesota, Iowa and Wisconsin, has a total of 1,158 Section 515 properties providing 25,561 units of affordable housing. With seven percent vacancy (1,853 vacant units), 23,708 households account for 32,880 tenants served under this program. In Minnesota, 8,980 households (38 percent of total Section 515 households in the Midwest) accommodate 13,435 tenants (41 percent of total Section 515 tenants in the Midwest), while in Wisconsin 7,531 households (32 percent) account for 10,199 tenants (31 percent) and in Iowa 7,472 households (32 percent) account for 9,246 tenants (28 percent). The majority of these Midwest properties are under limited profit ownership, with the remaining two-fifths under non-profit ownership. Two-thirds of the properties are designated as family housing, with almost all of the remaining designated as elderly housing. About 50 percent have 16-30 units, while more than 30 percent have fewer than 16 units and the remaining 20 percent have more than 30 units.
Reflecting the predominant demographic trends in nonmetropolitan areas of the Midwest, the tenant population is overwhelmingly White (93 percent) and over one-third are aged 65 or older. Other aspects of the tenant population differ from the overall population in nonmetropolitan areas of the Midwest. For example, 65 percent of Section 515 households are headed by females and three-quarters of Section 515 households use either Section 521 or Section 8 rental assistance vouchers.
The restrictive use clause on many of these properties has already expired throughout the Midwest. As of the end of June 2020, 44 percent of the units have lost the protection of the restrictive use clause, or the unit never had this classification. The Midwest will start to see the properties mature out of the Section 515 program as early as 2020, increasing in rate near the end of this decade.
Further analysis at the state level has been grouped by property information (including geographic distribution, property types and ownership, maturation dates, rental assistance attached to the property), property owners, and tenant information (including age, ethnicity/race, income/rental assistance used).
Properties
Minnesota has 456 Section 515 properties, the most among the three states, compared to 365 properties in Iowa and 337 properties in Wisconsin. The raw number of Section 515 properties is somewhat misleading given the different population sizes of these states. When controlling for population differences, Iowa actually has the largest number of 515 properties on a per capita basis. Minnesota Section 515 properties total 9,597 housing units, while Wisconsin properties account for 8,127 housing units and Iowa properties have 7,837 housing units.
Sources: Section 515 Properties: USDA Rural Development Datasets; Active Projects, 2020-07-17, (https://www.sc.egov.usda.gov/data/MFH_section_515.html)
MN, WI and IA Counties: US Census
MN Regions: Minnesota Housing Finance Authority, WI Regions: Wisconsin Department of Administration, Housing Regions
Property Location
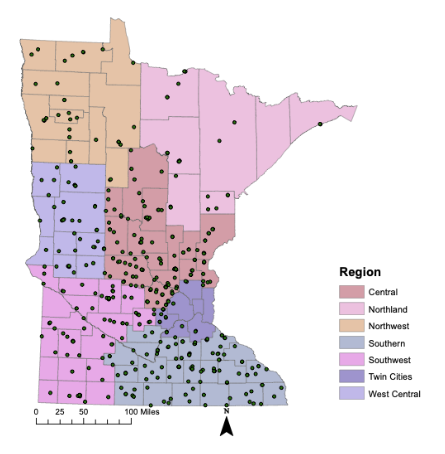
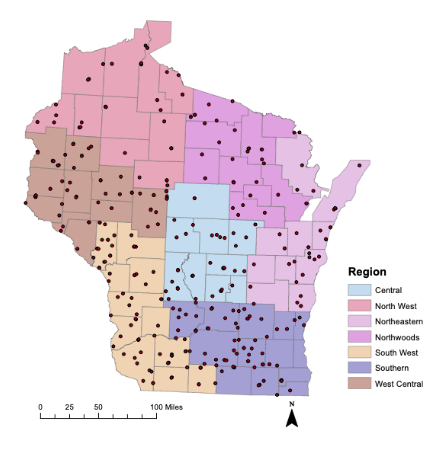
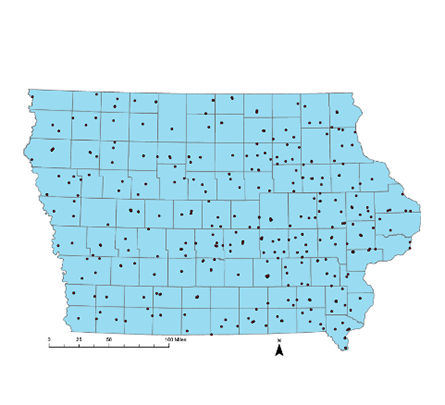
The locations of the Section 515 properties have been aggregated into three different levels for analysis: information is provided at the regional (within state), county, and state levels (Maps 1-3).
Region
The greatest number of Section 515 properties in Minnesota are found in the Central and Southern regions of Minnesota, accounting for 56 percent of properties and 57 percent of units. There are 257 properties nearly evenly split between these two regions. The fewest number of properties in Minnesota are found in the Northland region, with 26 properties yielding seven percent of the units. Although the West Central region has numerous properties (45) in comparison with other Minnesota regions, it also contributes to only seven percent of the units.
In comparison, two adjacent Wisconsin regions have 143 properties; together, the South West and Southern regions comprise 42 percent of properties and 44 percent of units. The 31 properties in Wisconsin’s Northeastern region account for the fewest number of Section 515 properties, but they contribute 10 percent of the units. In comparison, the Northwoods region has more properties (37), but these properties make up only nine percent of the units statewide. Iowa does not have designated regions relevant to Section 515 project data.
County
Although Minnesota has the most Section 515 properties overall, they are slightly less widely distributed among counties than the other states. In Minnesota, 82 out of the 87 counties (94 percent) have at least one Section 515 property. This is in comparison to Iowa where 98 percent of the counties contain at least one Section 515 property and Wisconsin where 97 percent of the counties have at least one Section 515 property. In considering the spread of Section 515 properties, it is notable that 14 counties in Iowa have only one Section 515 property, compared to nine Wisconsin counties and eight Minnesota counties with only one Section 515 property. Overall, the median number of Section 515 properties per county is 3, 4, and 5 for Iowa, Wisconsin, and Minnesota, respectively.
Minnesota tends to have large clusters of Section 515 housing units spread across counties in comparison to Wisconsin and Iowa. Minnesota has five counties with more than 300 housing units (ranging from 313 to 691); Wisconsin has only two counties with over 300 units (419 and 486). The greatest number of units found in an Iowa county is only 284; there are four counties in Iowa with more than 200 units. The median number of units in a county is 92 in Wisconsin, 89 in Minnesota, and 68 in Iowa.
Property Characteristics
Property Designation
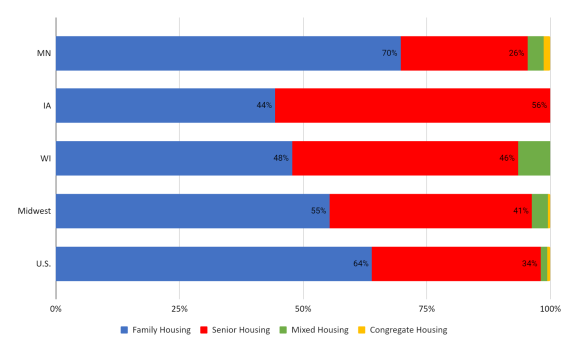
The extent to which the five different property type designations (family, elderly, congregate, mixed, and group housing) are represented in each state is shown in Figure 1. None of the states have a group housing designated Section 515 property and only Minnesota has congregate housing designated for six properties. Minnesota and Wisconsin have properties with the remaining property designations, although both states have less than 10 percent mixed housing. All three states have more family housing properties than elderly housing. Minnesota has the greatest percentage of family housing properties at 70 percent, compared to 56 percent of properties in Iowa and 48 percent of properties in Wisconsin with this designation. Minnesota’s elderly housing is approximately 25 percent, the lowest rate among the three states. Wisconsin has the greatest percentage of elderly housing at 46 percent, while Iowa has 44 percent. In comparison, in the U.S. overall about two-thirds of Section 515 properties are family housing and about one-third elderly housing.
Figure 1: Proportion of Buildings by Property Designation
Source: USDA Rural Development Dataset; Active Projects, 2020-07-17
(https://www.sc.egov.usda.gov/data/MFH_section_515.html)
Property Ownership Type
There are three property ownership types – full profit, limited profit, and nonprofit. Full profit owners receive the financial benefits from generating more income than the costs of operations. Limited profit, or “limited partnership,” is an ownership arrangement consisting of a general manager and one or more partners. The general manager is responsible for managing the business and has unlimited liability for the debt; the partners maintain a passive role in the management of the property and have a limited liability for the debt. Their liability is limited to the amount of their capital investment, and are thus called “limited partners.”[36] Nonprofit ownerships provide the public benefit of affordable housing, receiving certain tax exemptions from the Internal Revenue Service as a result.
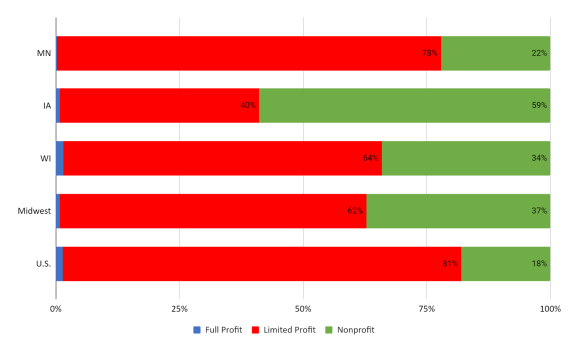
As Figure 2 illustrates, the majority of properties in Minnesota and Wisconsin have limited profit ownership (78 percent and 64 percent, respectively.) In Iowa, on the other hand, 59 percent of Section 515 properties are owned by non-profits. Iowa and Wisconsin have about one percent of properties operating as full profit properties. The distribution of property ownership types for Section 515 properties in the U.S. closely matches the distribution in Minnesota.
Figure 2: Section 515 Properties by Ownership Type*
Note: * Numbers may not aggregate to 100% due to rounding
Source: USDA Rural Development Dataset; Active Projects, 2020-07-17
(https://www.sc.egov.usda.gov/data/MFH_section_515.html)
Property Size and Vacancies
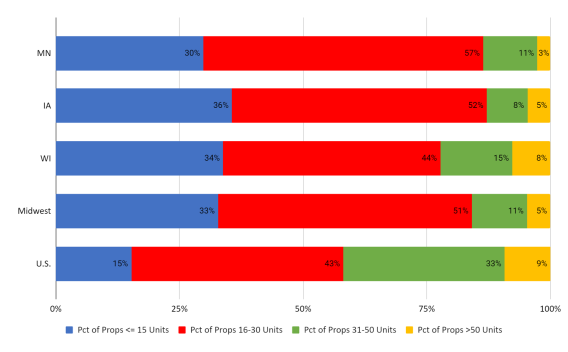
As Figure 3 indicates, in each of the three Midwestern states, the vast majority of properties have fewer than 30 units. Nearly 90 percent of Section 515 properties in Minnesota and Iowa have 30 or fewer units. In comparison, in the U.S. about 60 percent of Section 515 properties have fewer than 30 units. Notably, Section 515 properties in the Midwest are particularly concentrated at the smallest scale. About one-third of Section 515 properties in the Midwest have 15 or fewer units, compared to only 15 percent of Section 515 properties in the U.S. Minnesota has the lowest percentage of properties with 50 or more units (three percent), while Wisconsin has the highest rate (eight percent). Nearly 10 percent of Section 515 properties in the U.S. have more than 50 units.
Figure 3: Section 515 Properties by Size
Source: USDA Rural Development Dataset; Active Projects, 2020-07-17
(https://www.sc.egov.usda.gov/data/MFH_section_515.html)
Statewide, Section 515 properties must deal with unit vacancies of around seven percent in each of the Midwestern states. In comparison, vacancy rates were slightly lower (6 percent) in Section 515 properties in the U.S. The Central region of Wisconsin had the highest vacancy rate at 14 percent; the highest vacancy rate in Minnesota was found in the Southwest region at 11 percent. Wisconsin had the region with the lowest vacancy rate (four percent in the Southern region); Minnesota had two regions, Central and Southern, experiencing a five percent vacancy rate. These vacancy rates should be viewed with caution since some counties have only one Section 515 unit and when that is vacant, the vacancy rate for the county is reported as 100 percent.
Finance Age, Restrictive Use Clause Expiration, and Property Maturation
Given the age of the Section 515 program and the typical length of the restrictive use clause and mortgage maturation, data on the age of Section 515 mortgages can help predict when properties may exit the Section 515 program. Section 515 properties are typically financed through 50-year loans. The option to prepay on the mortgage is allowed if the property does not have a restrictive use clause or the restrictive use clause has expired. Thus, it is critical to understand the timing of the expiration of both this restrictive use clause and when the mortgages that financed the Section 515 properties are scheduled to mature.
In this analysis, the age of the properties is based on the financing date of operation, not the age of the physical structure (as this data is unavailable). About 75 percent of properties in Minnesota are at least 30 years old. In fact, the majority (53 percent) of Minnesota properties are between 31 and 40 years old. Iowa has the oldest Section 515 properties, with nearly 95 percent of the properties older than 30 years. In Iowa, 72 percent of Section 515 properties are older than 40 years, while more than 45 percent are older than 50 years. Wisconsin has the youngest properties, with about two-thirds older than 30 years.
Due to the older properties in Minnesota and Iowa, over half of properties in both states may never have had a restrictive use clause or these clauses have expired as of June 30, 2020. Again, as described above, this implies that the mortgage could be prepaid, removing the Section 515 affordable housing status. Wisconsin, with younger Section 515 properties, has a restrictive use clause on about 40 percent of its properties. On average, two percent of the units in the Section 515 housing stock lose the protection provided by the restrictive use clause in Minnesota and Wisconsin each year. In comparison, one percent of units in Iowa’s Section 515 housing stock loses protection each year.
These financing ages indicate that increasing numbers of Section 515 properties have mortgages that will mature through 2050. The peak in the number of Section 515 properties in the Midwest with mortgages that will mature occurs around 2030, with another peak around 2040. In Iowa, this translates into 24 percent and 11 percent of Section 515 units with mortgages that will mature in 2030 and 2040, respectively. About seven percent and nine percent of Section 515 units in Wisconsin have mortgages that will mature in 2030 and 2040, respectively. In comparison to Iowa and Wisconsin, a larger proportion of the Section 515 housing stock in Minnesota has mortgages that are scheduled to mature by 2040. In fact, between 2030 and 2040 over 55 percent of Section 515 properties in Minnesota have mortgages that are expected to mature, potentially resulting in about 56 percent of the Section 515 housing units exiting the program.
Section 521 Rental Assistance
The USDA has determined that the Section 521 Rental Assistance program will be associated strictly with Section 515 properties. In Minnesota, 96 percent of Section 515 properties have at least one unit with rental assistance. Although Minnesota has the highest number of units across the three states, it has the lowest rate of units receiving rental assistance (68 percent). Wisconsin has the lowest rate of properties with at least one unit with rental assistance (88 percent), but 71 percent of Section 515 units in the state have rental assistance. Iowa has the highest rate of properties and units receiving rental assistance (98 percent and 84 percent, respectively). Nationally, 92 percent of Section 515 properties have at least one unit with rental assistance and 75 percent of all units have rental assistance.
Reviewing this rental assistance within states by region, Minnesota’s Central region has the highest proportion of rental assistance units at 74 percent; the lowest share of rental assistance units is 62 percent in the West Central region of Minnesota. The Northwoods region in Wisconsin has the highest percentage of properties and units with rental assistance; 36 of the 37 properties, or 87 percent of the units use Section 521 rental assistance. The North West region of Wisconsin has the smallest share (57 percent) of units with rental assistance.
Property Ownership
The number of property owners with more than one Section 515 building and where these properties are located can provide insight into the spatial distribution of reduced subsidized housing stock that may result once the mortgages on Section 515 properties mature. For example, an owner with multiple Section 515 properties located in the same county could have a substantial effect on the supply of affordable housing there if they remove all the properties from the program upon loan maturation. On the other hand, having multiple properties by one owner spread across counties could have a lower economic impact on the area, particularly if the number of housing units in the properties is relatively small. However, for owners with large portfolios, a decision to remove properties from the Section 515 program after mortgage maturation could also have a substantial effect on the Section 515 housing stock in the state more generally, regardless of how spatially concentrated the properties are.
Iowa has 26 multi-property owners; both Minnesota and Wisconsin have 31 multi-property owners. Portfolios range from two to seven Section 515 properties. The largest portfolio consists of five properties in both Iowa and Wisconsin, and seven properties for one Minnesota owner. Across all three states, about three-quarters of the multi-property owners have two properties. In Iowa, 90 percent of multi-property owners located all their properties within one county. The proportions are slightly smaller in Wisconsin (77 percent) and Minnesota (61 percent).
The decisions made by multi-property owners could have the greatest impact in Wisconsin given that their portfolios account for 21 percent of properties and 18 percent of units. The portfolios in Iowa of multi-property owners contribute to 17 percent of both properties and units. The Minnesota portfolios of multi-property owners have the smallest contribution to the overall state total of Section 515 properties, with these portfolios accounting for 17 percent of properties, but only 14 percent of units.
Tenants
Section 515 housing provides homes for nearly 24,000 households, or 32,880 individuals, within these three Midwest states. Understanding the demographics of the tenants can help direct solutions for the populations currently benefiting from this type of housing.
Age and Head of Household
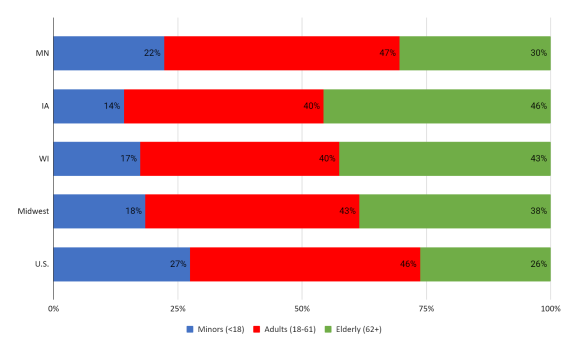
Minnesota has the lowest share of elderly and the highest share of children living in Section 515 housing, shown in Figure 4. The elderly tenant population is only 30 percent of the total residents living in Section 515 housing in Minnesota, compared to 43 percent in Wisconsin and 46 percent in Iowa. However, the elderly population in Section 515 housing in Minnesota tends to be concentrated in relatively few counties. Specifically, 17 counties in Minnesota have an elderly tenant population in their Section 515 properties that is at least 50 percent of the total Section 515 tenant population in the county. Minnesota has the highest share of children under the age of 18 living in Section 515 housing. Children comprise 22 percent of these tenants. In comparison, children are about 18 percent of the Section 515 residents in Wisconsin, while Iowa has a child population of 14 percent in Section 515 housing.
Figure 4: Proportion of Tenants by Age
Source: USDA Rural Development Dataset; Tenant Info, 2020-07-17
(https://www.sc.egov.usda.gov/data/MFH_section_515.html)
The lowest share of disabled or handicapped residents is in Minnesota, with 17 percent. Iowa disabled or handicapped residents exceed 30 percent of the share of Section 515 tenants, while the share in Wisconsin is slightly over 20 percent. Nationally,19 percent of residents living in Section 515 properties are disabled or handicapped.
All states in the Midwest had approximately two-thirds female heads of households in Section 515 properties. Minnesota had the greatest difference in female-headed households among counties, ranging from as low as 27 percent of households to 87 percent of households. Wisconsin ranged from 35 to 82 percent and Iowa from 38 to 86 percent.
Ethnicity/Race
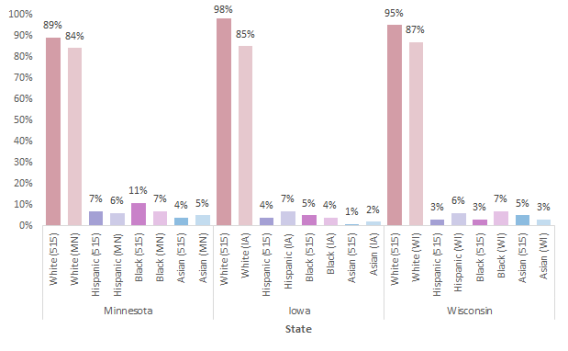
In this analysis of race and ethnicity of Section 515 residents (Figure 5), we assume that tenants could select more than one racial category when reporting this information since the racial categories in some counties sum to more than 100 percent. The share of residents identifying as Hispanic in Minnesota Section 515 housing is relatively comparable with the share in the state overall: seven percent in Section 515 compared to six percent statewide. Wisconsin and Iowa have a lower share of Hispanic residents in Section 515 housing compared to their statewide shares. In Wisconsin, four percent of the Section 515 residents indicated Hispanic ethnicity compared with seven percent of the state. Iowa has an even lower rate of three percent in Section 515 housing, with six percent of Iowa residents overall.
The prevailing racial identity for residents in Section 515 housing among all three states is White. In each state, there is a higher percentage of White living in Section 515 housing units compared with the overall state population. Minnesota has the lowest share, with 89 percent of its tenants identifying as White, compared to a statewide share of 84 percent. Iowa has the greatest share, with 98 percent of Section 515 tenants identifying as White compared to 85 percent of state residents.
The next largest racial demographic group living in Section 515 housing is Black in Minnesota and Iowa, while Wisconsin has a more populous group of Asian residents. Black tenants in Minnesota make up 11 percent of the share (compared to 7 percent statewide) and Black tenants comprise five percent of Section 515 tenants in Iowa (versus four percent statewide.) Similarly, in Wisconsin, the Asian population makes up 5 percent of the tenants in Section 515 properties, but three percent in the state population.
Figure 5: Ethnicity / Race - 515 Residents vs Overall State Demographics
Source: USDA Rural Development Dataset, Tenant Info, 2020-07-17; US Census Quickfacts, Statewide Demographics
(https://www.sc.egov.usda.gov/data/MFH_section_515.html, https://www.census.gov/quickfacts/MN)
Income/Rental Assistance
The USDA recorded average household incomes in each Section 515 property. To calculate the average Section 515 household income by county, we weighted the average household incomes by the number of housing units in each property located in the county and reported the minimum and maximum county average household income (weighted) for Section 515 properties in each state. As Table 1 shows, the range of the county average household income for Section 515 properties was widest in Minnesota, followed by Iowa and Wisconsin. Perhaps reflecting the low proportion of elderly tenants in Section 515 properties in the state, Minnesota counties had the lowest share of Social Security income among tenants in the Midwest.
Table 1: Range of Weighted Average Incomes Per County with Section 515 Properties
| State | Min ($) | Max ($) | Difference ($) | Number of Counties |
|---|---|---|---|---|
| MN | 10,156 | 28,410 | 18,254 | 82 |
| WI | 10,473 | 19,959 | 9,486 | 70 |
| IA | 7,646 | 22,447 | 14,801 | 97 |
Note: Data reported for Minnesota exclude a county with a weighted average for household income of $41,550, which we consider to be an outlier given prevailing income levels of other counties.
Source: USDA Rural Development Dataset; Tenant Info and Active Projects, 2020-07-17
(https://www.sc.egov.usda.gov/data/MFH_section_515.html)
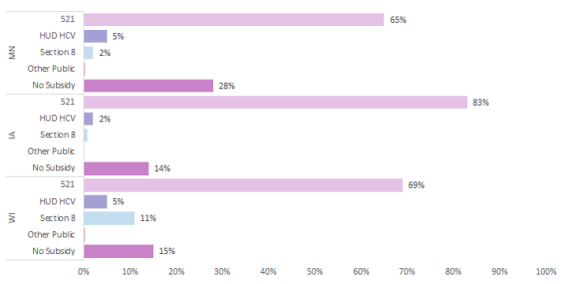
As shown in Figure 6, the types of rental assistance used are compared among the three states. Minnesota had the smallest share of tenants using rental assistance in the Section 515 program, with only 72 percent of tenants utilizing aid. In Wisconsin and Iowa about 85 percent of tenants used rental assistance. The county with the lowest share of rental assistance among tenants was in Iowa (33 percent), though Minnesota was close behind at 39 percent. In contrast, Wisconsin’s lowest proportion of tenants receiving rental assistance was 57 percent. Each of the states had counties with 100 percent rental assistance, reflecting properties with 100 percent Section 521 assistance or counties with both Section 521 and HUD’s Housing Choice Vouchers in use by tenants.
Nearly two-thirds of Minnesota Section 515 tenants used the Section 521 rental assistance compared to 83 percent of Iowa tenants. Other rental assistance is used but at much lower rates. Project Based Section 8 assistance was most widespread in Wisconsin (11 percent), whereas HUD’s Housing Choice Vouchers were used more in Minnesota (5 percent) and Iowa (2 percent).
Figure 6: Additional Subsidies for Section 515 Housing Units, by State
Source: USDA Rural Development Dataset; Tenant Info, 2020-07-17
(https://www.sc.egov.usda.gov/data/MFH_section_515.html)
Looking more closely at the county level within the states for rental assistance options other than Section 521, one county in Minnesota makes greater use of HUD’s Housing Choice Voucher (57 percent) whereas another county utilizes Project Based Section 8 (54 percent). Some counties within Wisconsin and Iowa make far greater use of the Project Based Section 8 assistance (82 percent and 89 percent respectively), with other counties having 25 to 30 percent of their tenants making use of HUD’s Housing Choice Voucher.
Conclusion
The Section 515 housing program offers needed affordable housing options in rural America at a time when residents of rural places find it increasingly difficult to find affordable housing. Our analysis indicates that in the Midwest, Section 515 properties are generally well distributed in rural counties and tend to be characterized by small scale multifamily properties. Throughout the Midwest, but particularly in Wisconsin and Iowa, Section 515 housing is a crucial affordable housing option for elderly households living in rural counties. Limited profit ownership structures predominate Section 515 properties, suggesting the small-scale investors that approach real estate investments with less sophistication and more limited sources of capital are important stakeholders in the program.
Of primary concern for current residents in Section 515 properties is the potential for large-scale exit of properties from the Section 515 program in the coming decades. Across the Midwest, but especially in Minnesota and Iowa, the age of Section 515 property financing suggests that large proportions of the mortgages used to finance the properties and keep them affordable will mature in the coming decades. As the mortgages mature, an increasing share of Section 515 properties will have the option of exiting the program and reverting to market rents. Upon a property’s exit, low-income tenants living in the properties will lose the rental assistance that is tied to the Section 515 unit and experience an increase in the amount of rent they owe. If this situation is not addressed with new investments in affordable housing in rural areas or an attempt to alter the Section 515 program to make it more likely that properties will remain in the program, some of the most vulnerable low-income households in rural areas of the Midwest may experience substantial increases in rent and potential dislocation.
Sources
[1] USDA 515 Property Exit Data Jul. 2020
[2] Thomas L. Daniels & Mark B. Lapping (1996). The Two Rural Americas Need More, Not Less Planning, Journal of the American Planning Association, 62:3, 285-288.
[3] Daniels & Lapping (1996), 285-288.
[4] Lois Wright Morton, Beverlyn Lundy Allen, Tianyu Li (2004). Rural Housing Adequacy and Civil Structure. Sociological Inquiry, 4(4), 464-491.
[5] Morton, Allen, & Li (2004), 464-491.
[6] Ann Ziebarth (2015). Renting in Rural America. Family and Consumer Sciences Research Journal, 44(1), 88–104.
[7] Ziebarth (2015), 88-104.
[8] Ziebarth (2015), 88-104.
[9] Ziebarth (2015), 88-104.
[10] Cook et al., Evidence of a Housing Decision Chain in Rural Community Vitality, 2009
[11] Ziebarth (2015), 88–104.
[12] Housing Assistance Council (HAC). (2012b). Taking stock: Rural people, poverty and housing in the 21st century. Washington, DC: author.
[13] Ziebarth (2015), 88–104.
[14] Ziebarth (2015), 88-104.
[15] Ziebarth (2015), 88-104.
[16] Ziebarth (2015), 88-104.
[17]Asche, Kelly (2018). The Workforce Housing Shortage: Getting to the Heart of the Issue. Center for Rural Policy and Development.
[18] Ziebarth (2015), 88-104.
[19] Ziebarth (2015), 88-104.
[20] Ziebarth (2015), 88-104.
[21] Ziebarth (2015), 88-104.
[22] Ziebarth (2015), 88-104.
[23] Ziebarth (2015), 88-104.
[24] Ziebarth (2015), 88-104.
[25] Bruce E. Foote (2010). USDA Rural Housing Programs: An Overview. Congressional Research Service.
[26] Foote (2010).
[27] HAC (2011). USDA Rural Rental Housing Loans (Section 515). Washington DC: Housing Assistance Council. p. 2. http://www.ruralhome.org/storage/documents/rd515rental.pdf
[28] USDA RD. (2005). Chapter 2: Multi-Family Housing Programs and Loan Servicing. HB-3-3560 (pp. 62-64).
[29] USDA RD. (2005). Chapter 2: Multi-Family Housing Programs and Loan Servicing. HB-3-3560 (pp. 62-64).
[30] Cassella, J., & Anders, G. (2018). An Advocate’s Guide to Rural Housing Preservation: Prepayments, Mortgage Maturities, and Foreclosures. San Francisco, CA: The National Housing Law Project. p. 7. https://www.nhlp.org/wp-content/uploads/2018/05/Rural-Preservation-Handbook.pdf
[31] Cassella & Anders, p. 2.
[32] Cassella & Anders, p. 7.
[33] Cassella & Anders, p. 7.
[34] Cassella & Anders, pp. 8-9
[35] Cassella & Anders, pp. 10-11.
[36] USDA RD. (2005). 7 CFR Part 3560--Direct Multi-Family Housing Loans and Grants. HB-3-3560 (Appendix 1, p. 28)

