Diversity Index
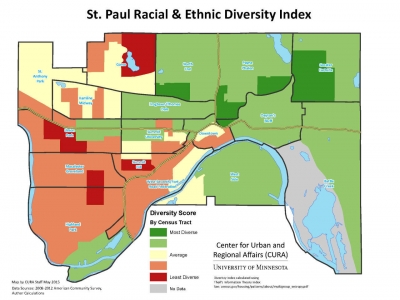
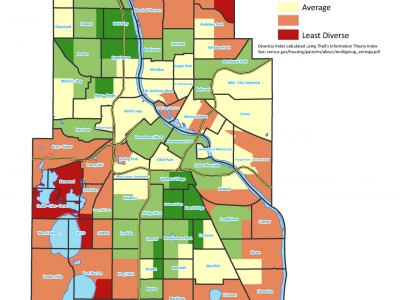
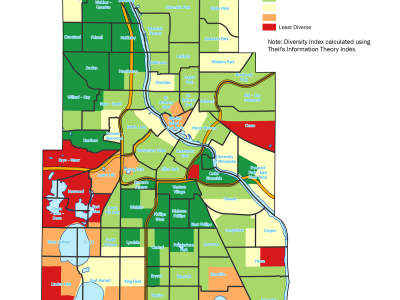
A couple of weeks ago, we posted a map of Minneapolis Racial/Ethnic Diversity Index. One of our Twitter followers very wisely requested we apply the same lens to the City of St. Paul. Here is that map.
What does this map show?This map shows the diversity score* of St. Paul…