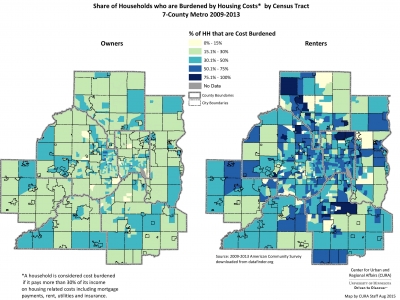
The Atlantic’s CityLab posted an article on a map detailing declining home ownership rates in urban areas developed by the journalist and web developer Ken Schwencke.

Sarah Hernandez with the McKnight Foundation suggested that a closer look be taken at renters in the Twin Cities. Here are some of the maps made in…

A couple of weeks ago, we posted a map of Minneapolis Racial/Ethnic Diversity Index. One of our Twitter followers very wisely requested we apply the same lens to the City of St. Paul. Here is that map.

What does this map show?

This map shows the diversity score* of St. Paul neighborhoods. “Diversity” refers to the relative proportions of racial and ethnic groups in an area (here, census tracts). An area has a high diversity score if it has more equal proportions of different racial and ethnic groups. An area with a low score has…

Racial and ethnic diversity in the City of Minneapolis, using 2010 Census data (block level). Created by CURA staff, 2012.